
Please refer to important disclosures at the end of this report
1
Amber Enterprises India Ltd. (Amber) is the market leader in the room air
conditioner (RAC) outsourced manufacturing space in India with a market share
of 55.4%. It is a one-
stop solutions provider for the major brands in the RAC
industry and currently ser
ves eight out of the ten top RAC brands in India
including Panasonic, LG, Daikin, Hitachi, Whirlpool, Voltas, Blue Star and
Godrej.
Market leadership driven by integration and R&D: Amber
commands 19% market
share in Indian RAC manufacturing through its
11 manufacturing facilities
strategically located across India. In a short span of nine
years, it has evolved
from being original equipment manufacturing (OEM) to high-
margin Original
Design Manufacturing (ODM) in RACs mainly led by high degree of backwar
d
integration and strong R&D capabilities.
Favorable industry trends: Amber is in a sweet spot, as the
RAC industry is
growing at
12%+CAGR. In the RAC industry, the share of ODM is expected to
grow by 25% CAGR to reach 56% of the RAC market by 2022 (from
current 34%).
These factors favor Amber owing to its focus on ODM. Further, t
he product
approval cycle goes beyond 2-3 years creating a
moat for Amber to keep the
competition under check.
Margin expansion and debt reduction: The Company has been able to i
mprove
its margins to 9
% in H1FY18 led by higher capacity utilization and robust demand
in RACs. Further, current utilization at sub 50% is likely to grow in future,
providing operating leverage and thereby enhance margins. Moreover, Amber
has been genera
ting positive cash flow from operations over the last 5 years and
will have negligible debt post IPO. The company is not planning to undertake any
major capex in the next 2-3 years.
Outlook & Valuation:
At the upper end of the price band, the P/E multiple works
out be 80x (pre issue equity base) of FY17 EPS which prima-
facie looks on the
higher side. However, considering future earnings growth trajectory to be very
robust (FY19 earnings expected to be 4x
of FY17 earnings); we feel that the stock
would trade at ~22-
25x (post issue equity base) on our rough EPS for FY2020
which looks very attractive. Its closest peer -
Dixon Technologies is trading at
higher valuation of 30x FY20 earnings. We recommend ‘SUB
SCRIBE’ on the issue
for a mid-to-long term period.
Key Financial
Y/E March (` cr) FY14 FY15
FY16
FY17
Net Sales
973
1,230
1,089
1,644
% chg
11
26
-
11
51
Net Profit
21
28
24
28
% chg
13
33
-
14
16
EBITDA (%)
7.7
8.3
10.4
7.8
EPS (Rs)*
8.1
10.8
9.3
10.8
P/E (x)
106.0
79.9
92.4
79.8
P/BV (x)
10.6
9.3
8.5
6.6
RoE (%)
10.0
11.7
9.2
8.3
RoCE (%)
12.1
14.1
14.1
13.1
EV/EBITDA
38.5
28.7
26.2
23.2
EV/Sales
3.0
2.4
2.7
1.8
Source: RHP, Angel Research; Note: *Ratios based on pre-issue outstanding shares and at
upper end of the price
band
SUBSCRIBE
Issue Open: January 17, 2018
Issue Close: January 19, 2018
QIBs 50% of issue
Non-Institutional 15% of issue
Retail 35% of issue
Promoters
44%
Others
56%
Fresh issue: *0.55cr shares
Issue Details
Face Value:
`10
Present Eq. Paid up Capital:
`29.5
cr
Offer for Sale: *0.145cr shares
Post-Issue Shareholding Pattern
Post Eq. Paid up Capital: *
`31.4
cr
Issue size (amount): *
`
600 cr
Price Band:
`855-859
Lot Size: 17 shares and in multiple
thereafter
Post-issue implied mkt. cap: *`2701 cr
Promoters holding Pre-Issue: 59%
Promoters holding Post-Issue: 44
%
* Calculated on upper price band
Book Building
Nidhi Agrawal
+022 39357600, Extn: 6872
nidhi.agrawal@angelbroking.com
Amber Enterprises India Ltd
IPO Note | Consumer Durable
January 15, 201
8

Dixon Technologies Limited | IPO Note
January 15, 2018
2
Company background
The company was incorporated as Amber Enterprises India Private Limited on April
2, 1990 at Jalandhar, Punjab, as a private limited company under the Companies
Act, 1956. It was converted to a public limited company pursuant to a special
resolution passed by its shareholders on September 20, 2017. From a single
factory in Rajpura, Punjab, that commenced operations in 1994, it has grown to
11 manufacturing facilities across seven locations in India. Its manufacturing
facilities have a high degree of backward integration and are strategically located
in proximity to its customers’ facilities. It has also seen three rounds of private
capital infusion (IFCI Venture Capital Funds Limited, Reliance Alternative
Investments Fund – Private Equity Scheme-I through Fairwinds Trustees Services
Private Limited and ADV Opportunities Fund LLP through their investment entity
Ascent).
Product portfolio:
RAC: It designs and manufactures complete RAC including window air
conditioners (WAC), indoor units (IDU) and outdoor units (ODU) of split air
conditioners (SAC) with specifications ranging from 0.75 ton to 2 ton, across
energy ratings and types of refrigerants. It also designs and manufactures
inverter RAC ranging from 1 ton to 2 ton.
RAC Components: It manufactures critical and reliability functional
components of RACs such as heat exchangers, motors and multi-flow
condensers. It manufactures other RAC components such as sheet metal
components, copper tubing and injection molding components.
Other Components: It manufactures components for other consumer durables
and automobiles such as case liners for refrigerator, plastic extrusion sheets
for consumer durables and automobile industry, sheet metal components for
microwave, washing machine tub assemblies and for automobiles and metal
ceiling industries.

Dixon Technologies Limited | IPO Note
January 15, 2018
3
Company timeline
Year Particulars
1990 Incorporated as a private limited company.
1994 The first factory at Rajpura was established
2003-04 Started Dehradun Plant for RAC manufacturing for LG
2004 Dehradun Factory Unit - 4 established
2005-06 Started manufacturing microwave ovens for LG
2008 Started Noida Ecotech Unit
2007-08 Started manufacturing heat exchangers
2009 Dehradun Factory Unit – 5 was established
2010 Kasna Unit, Kala Amb Unit and Pune Unit established
2010 Dehradun Factory Unit – 6 was established
2012 Jhajjar Unit was established
2011 Investment by Green India Venture Fund
2012
Investment by Reliance Alternative Investments Fund – Private Equity Fund
Scheme – I; Acquisition of PICL
Investment by Ascent and exit to Reliance Alternative Investments Fund – Private
Equity Fund Scheme – I through purchase by Ascent.
Source: Company
Issue Details
This IPO is a mix of OFS and issue of fresh shares. Issue would constitute fresh
issue worth of `475cr and OFS worth of `125cr. OFS is being offered by two of its
promoters.
Exhibit 1: Pre and post-IPO shareholding pattern
No of shares (Pre-issue) % No of shares (Post-issue) %
Promoter 15297417 59%
13842237 44%
Non-promoter investors *
10619438 41%
10619438 34%
Public
5529686 18%
Total
25916855 100% 31446543 100%
Source: RHP, Angel Research; Note: Calculated on upper price band* Pre IPO investors
Objects of the offer
Repayment/pre-payment, in full or in part, of certain borrowings availed by
the company (`345cr)
General corporate purpose

Dixon Technologies Limited | IPO Note
January 15, 2018
4
Key Management Personnel
Jasbir Singh is the Chairman and Chief Executive Officer of the Company. He
holds a Bachelors degree in engineering (industrial production) from Karnataka
University and Masters degree in business administration from the University of
Hull, United Kingdom. He was appointed to the Board of the Company since
October 1, 2004. He has over 13 years of experience in the RAC manufacturing
sector. He has played an instrumental role in successful acquisition of PICL (India)
Private Limited in 2012.
Daljit Singh is the Managing Director of the Company. He holds a Bachelors
degree in electronic engineering from Nagpur University and Masters degree in
information technology from the Rochester Institute of Technology. He has received
‘Entrepreneur of the Year 2016’ award from Ludhiana Management Association.
He was appointed to the Board of the Company on January 1, 2008. Prior to
joining this Company, he was associated with Morgan Stanley in New York as an
analyst.
Manoj Kumar Sehrawat is a Nominee Director of the Company nominated by
Ascent and was appointed to the Board of Company in January 12, 2017. He has
20 years of experience in financial services. He is a managing director at ADV
Partners Management Pte. Limited (ADV), the manager to a sub fund of ADV
Opportunities Fund LLP, a Cayman Islands exempted limited partnership.
Dixon Technologies Limited | IPO Note
January 15, 2018
5
Investment Rationale
Market leadership driven by integration and R&D: Amber commands 19%
market share in Indian RAC manufacturing through its 11 manufacturing
facilities strategically located across India. In a short span of nine years, it has
evolved from being original equipment manufacturing (OEM) to high-margin
Original Design Manufacturing (ODM) in RACs mainly led by high degree of
backward integration and strong R&D capabilities.
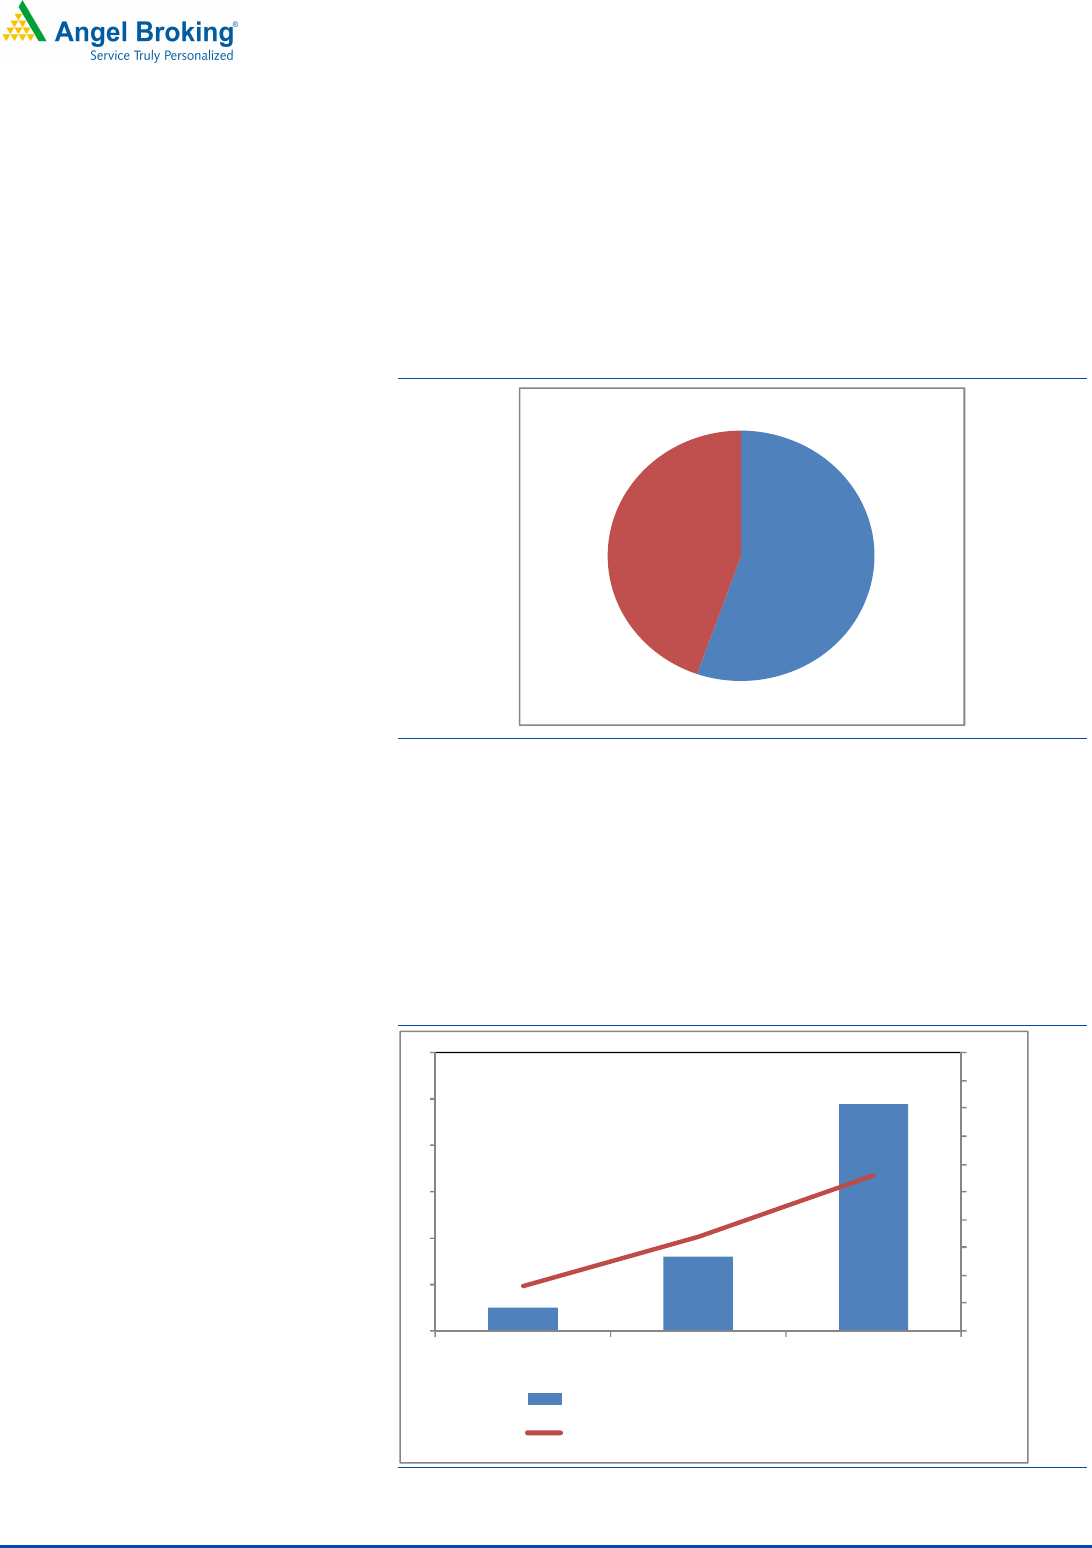
Exhibit 2: Market share in FY17 in OEM/ ODM manufacturing
Source: RHP, Frost and Sullivan
Favorable industry trends: Amber is in a sweet spot, as the RAC industry is
growing at 12%+CAGR. In the RAC industry, the share of ODM is expected to
grow by 25% CAGR to reach 56% of the RAC market by 2022 (from current
34%). These factors favor Amber owing to its focus on ODM. Further, the
product approval cycle goes beyond 2-3 years creating a moat for Amber to
keep the competition under check. Amber has posted revenue CAGR of 19%
FY14-17, which would further witness improvement as the company is now
exploring export opportunities to UAE, Oman, SriLanka, Nigeria & Maldives.
Exhibit 3: Rising share of OEM/ODM
0%
10%
20%
30%
40%
50%
60%
70%
80%
90%
100%
0
1
2
3
4
5
6
FY12 FY17 FY22E
ODM/ OEM volume (Mn) (LHS)
Conribution as % of total RAC volume (RHS)
Source: RHP, Frost and Sullivan
Amber
55%
Others
45%
Dixon Technologies Limited | IPO Note
January 15, 2018
6
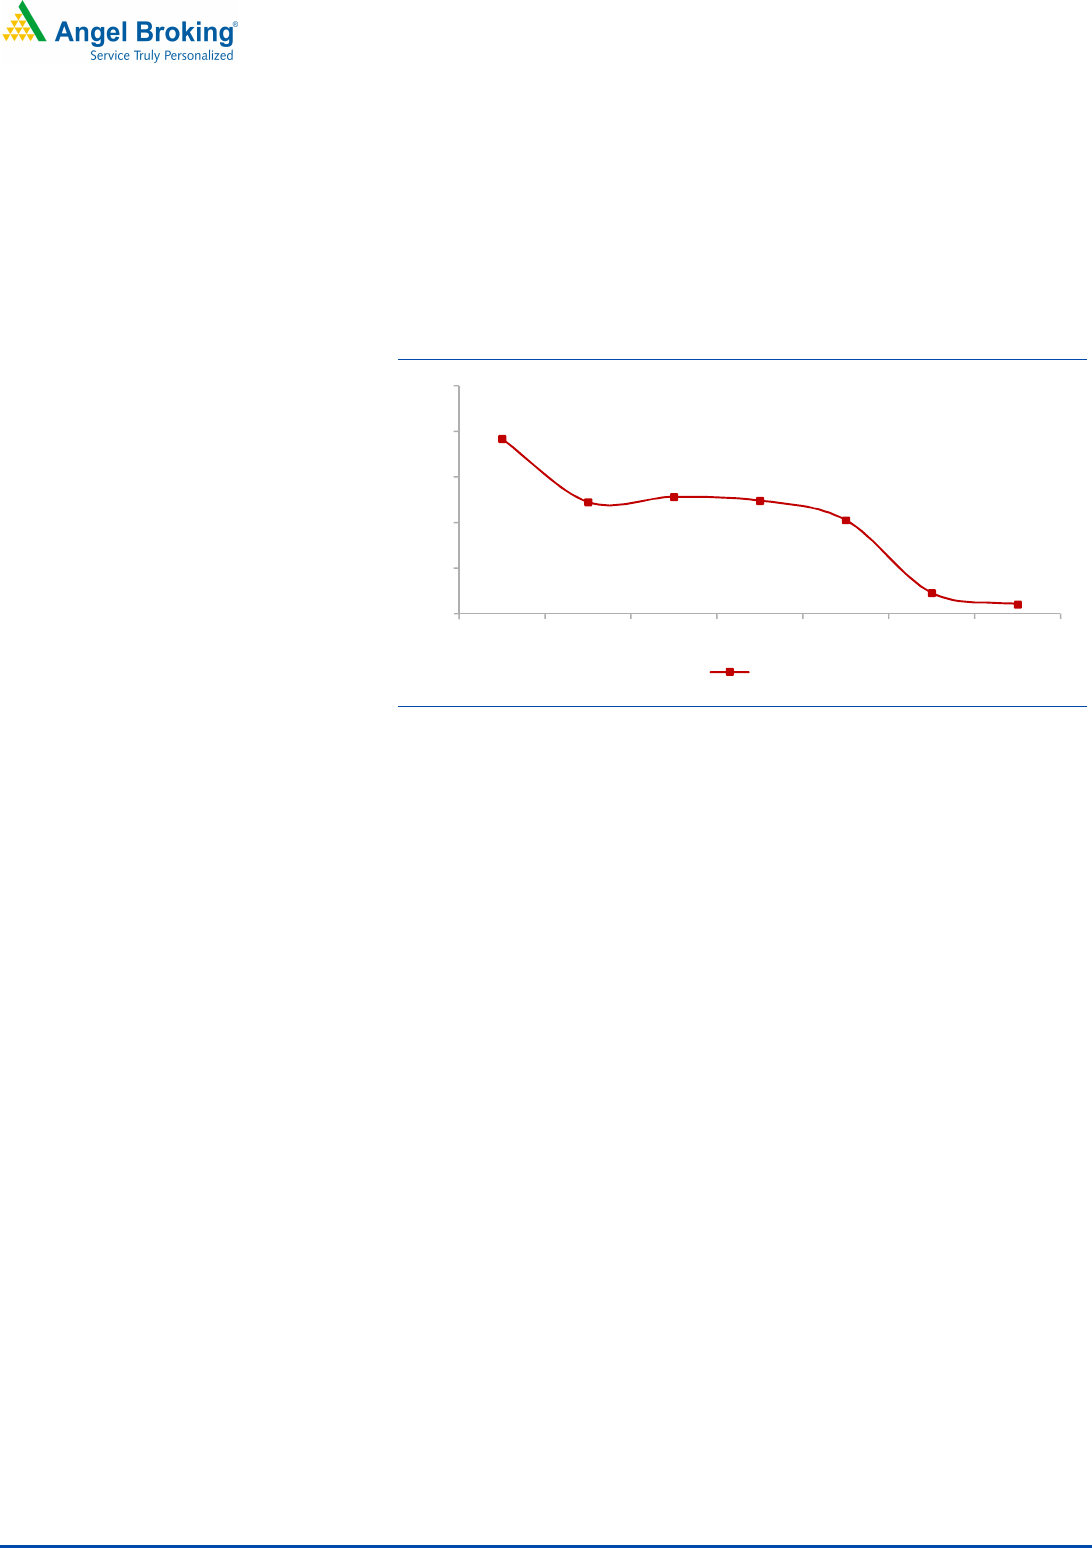
Margin expansion and debt reduction: The company has been able to improve
its margins to 9% in H1FY18 led by higher capacity utilization and robust
demand in RACs. Further, current utilization at sub 50% is likely to grow in
future, providing operating leverage and thereby enhance margins. Moreover,
Amber has been generating positive cash flow from operations over the last 5
years and will have negligible debt post IPO. The company is not planning to
undertake any major capex in next 2-3 years. It plans to repay debts out of
IPO proceeds, boosting PAT from FY19 onwards.
Exhibit 4: DE ratio to go down post IPO
Source: RHP, Company, Angel Research
1.9
1.2
1.3
1.2
1.0
0.2
0.1
-
0.5
1.0
1.5
2.0
2.5
FY14 FY15 FY16 FY17 FY18E FY19E FY20E
DE

Dixon Technologies Limited | IPO Note
January 15, 2018
7
Outlook & Valuation
At the upper end of the price band, the P/E multiple works out be 80x (pre
issue equity base) of FY17 EPS which prima facie looks on the higher side.
However, considering future earnings growth trajectory to be very robust (FY19
earnings expected to be 4x of FY17 earnings); we feel that the stock would
trade at ~22-25x (post issue equity base) on our rough EPS for FY2020 which
looks very attractive. Its closest peer - Dixon Technologies is trading at higher
valuation of 30x FY20 earnings. We recommend ‘SUBSCRIBE’ on the issue for
a mid-to-long term period.
Key risks
Client concentration
Amber’s business is dependent on certain principal customers and the loss of
or a significant reduction in purchases by such customers could adversely
affect its business, financial condition, results of operations and future
prospects. Sales to its top five and top 10 customers contributed 74.8% and
92.5% respectively in FY17.
Downward trend in OEM/ODM business
In recent years, RAC brands have increasingly outsourced the manufacturing
of their products to OEM/ODM players like Amber. However, there can be no
assurance that they will continue to do so in the future.
Changing preferences, advancement in technology
The markets in which company’s customers compete are characterized by
consumers and their rapidly changing preferences, advancement in
technology and other related factors including lower manufacturing costs.
Hence, the company may be affected by any disruptions in the industry.

Dixon Technologies Limited | IPO Note
January 15, 2018
8
Consolidated Income Statement
Y/E March (` cr) FY14
FY15
FY16 FY17
Total operating income
973.4
1,230.3
1,089.0
1,644.4
% chg
11.2
26.4
-
11.5
51.0
Total Expenditure
898.5
1,127.7
975.3
1,515.8
Raw Material
797.9
1,013.4
858.5
1,373.8
Personnel
32.0
33.5
36.5
43.8
Others Expenses
68.6
80.8
80.3
98.2
EBITDA
74.9
102.6
113.7
128.6
% chg
35.5
37.0
10.9
13.1
(% of Net Sales)
7.7
8.3
10.4
7.8
Depreciation& Amortisation
18.4
25.6
30.9
39.7
EBIT
56.5
77.0
82.9
88.9
% chg
31.8
36.4
7.6
7.3
(% of Net Sales)
5.8
6.3
7.6
5.4
Interest & other Charges
32.3
42.8
53.2
58.3
Other Income
6.3
6.2
3.1
7.9
(% of Sales)
0.6
0.5
0.3
0.5
Recurring PBT
30.5
40.4
32.7
38.4
% chg
4.7
32.4
-
19.0
17.4
Tax
8.3
11.6
8.6
10.5
PAT (reported)
21.0
27.9
24.1
27.9
% chg
12.7
32.7
-
13.5
15.7
(% of Net Sales)
2.2
2.3
2.2
1.7
Basic & Fully Diluted EPS (Rs)
8.1
10.8
9.3
10.8
% chg
12.7
32.7
-
13.5
15.7
Source: RHP

Dixon Technologies Limited | IPO Note
January 15, 2018
9
Consolidated Balance Sheet
Y/E March (` cr) FY14
FY15
FY16 FY17
Sources of funds
Equity Share Capital
21.7
21.7
21.7
23.8
Reserves& Surplus
187.8
216.8
240.9
311.1
Shareholders’ Funds
209.5
238.5
262.6
334.9
Minority Interest
3.7
-
- -
Total Loans
257.3
306.7
326.6
344.9
Other Liab & Prov
22.4
56.3
80.8
46.8
Total Liabilities
492.9
601.5
670.0
726.6
Application of funds
Net Block
400.8
470.1
536.1
577.5
Current Assets
435.3
500.0
533.6
650.4
Inventories
174.2
189.4
225.8
267.7
Sundry Debtors
158.4
231.6
247.9
310.4
Cash
50.6
28.9
18.4
34.7
Loans & Advances
48.4
47.7
40.6
37.1
Other Assets
3.7
2.4
1.0
0.5
Current liabilities
368.2
404.4
445.0
560.0
Net Current Assets
67.1
95.6
88.6
90.4
Other Non Current Asset
25.0
35.8
45.3
58.6
Total Assets 492.9
601.5
670.0 726.6
Source: RHP

Dixon Technologies Limited | IPO Note
January 15, 2018
10
Consolidated Cash Flow Statement
Y/E March (` cr)
FY14
FY15 FY16 FY17
Cash flow from operating activities
113.7
80.9 152.2 98.5
Cash flow from Investing activities
-
115.2
-86.5 -83.9 -89.7
Cash flow from financing activities
-
4.1
0.8 -67.9 -1.2
Net increase/(decrease) in cash & cash equivalents
-
5.7
-4.9 0.4 7.6
Opening cash and cash equivalents
12.6
6.9 2.0 2.4
Closing cash and cash equivalents
6.9
2.0 2.4 10.0
Source: RHP
Key Ratios
Y/E March
FY14
FY15
FY16 FY17
Valuation Ratio (x)
P/E (on FDEPS)
106.0
79.9
92.4 79.8
P/CEPS
30.5
22.8
23.9 19.9
P/BV
10.6
9.3
8.5 6.6
EV/Sales
3.0
2.4
2.7 1.8
EV/EBITDA
38.5
28.7
26.2 23.2
EV / Total Assets
5.8
4.9
4.4 4.1
Per Share Data (Rs)
EPS (Basic)
8.1
10.8
9.3 10.8
EPS (fully diluted)
8.1
10.8
9.3 10.8
Cash EPS
28.1
37.7
36.0 43.2
Book Value
80.8
92.0
101.3 129.2
Returns (%)
ROCE
12.1
14.1
14.1 13.1
Angel ROIC (Pre-tax)
15.6
15.4
13.7 13.7
ROE
10.0
11.7
9.2 8.3
Turnover ratios (x)
Asset Turnover (Gross Block)
2.4
2.6
2.0 2.8
Inventory / Sales (days)
65
56
76 59
Receivables (days)
59
69
83 69
Payables (days)
75
72
95 99
Working capital cycle (days)
49
53
64 29
Source: RHP, Angel Research

Dixon Technologies Limited | IPO Note
January 15, 2018
11
Research Team Tel: 022
-
39357800 E
-
mail: research@angelbroking.
com Website:
www.angelbroking.com
DISCLAIMER
Angel Broking Private Limited (hereinafter referred to as “Angel”) is a registered Member of National Stock Exchange of India Limited,
Bombay Stock Exchange Limited and Metropolitan Stock Exchange Limited. It is also registered as a Depository Participant with CDSL
and Portfolio Manager with SEBI. It also has registration with AMFI as a Mutual Fund Distributor. Angel Broking Private Limited is a
registered entity with SEBI for Research Analyst in terms of SEBI (Research Analyst) Regulations, 2014 vide registration number
INH000000164. Angel or its associates has not been debarred/ suspended by SEBI or any other regulatory authority for accessing
/dealing in securities Market. Angel or its associates/analyst has not received any compensation / managed or co-managed public
offering of securities of the company covered by Analyst during the past twelve months.
This document is solely for the personal information of the recipient, and must not be singularly used as the basis of any investment
decision. Nothing in this document should be construed as investment or financial advice. Each recipient of this document should
make such investigations as they deem necessary to arrive at an independent evaluation of an investment in the securities of the
companies referred to in this document (including the merits and risks involved), and should consult their own advisors to determine
the merits and risks of such an investment.
Reports based on technical and derivative analysis center on studying charts of a stock's price movement, outstanding positions and
trading volume, as opposed to focusing on a company's fundamentals and, as such, may not match with a report on a company's
fundamentals. Investors are advised to refer the Fundamental and Technical Research Reports available on our website to evaluate the
contrary view, if any.
The information in this document has been printed on the basis of publicly available information, internal data and other reliable
sources believed to be true, but we do not represent that it is accurate or complete and it should not be relied on as such, as this
document is for general guidance only. Angel Broking Pvt. Limited or any of its affiliates/ group companies shall not be in any way
responsible for any loss or damage that may arise to any person from any inadvertent error in the information contained in this report.
Angel Broking Pvt. Limited has not independently verified all the information contained within this document. Accordingly, we cannot
testify, nor make any representation or warranty, express or implied, to the accuracy, contents or data contained within this document.
While Angel Broking Pvt. Limited endeavors to update on a reasonable basis the information discussed in this material, there may be
regulatory, compliance, or other reasons that prevent us from doing so.
This document is being supplied to you solely for your information, and its contents, information or data may not be reproduced,
redistributed or passed on, directly or indirectly.
Neither Angel Broking Pvt. Limited, nor its directors, employees or affiliates shall be liable for any loss or damage that may arise from
or in connection with the use of this information.